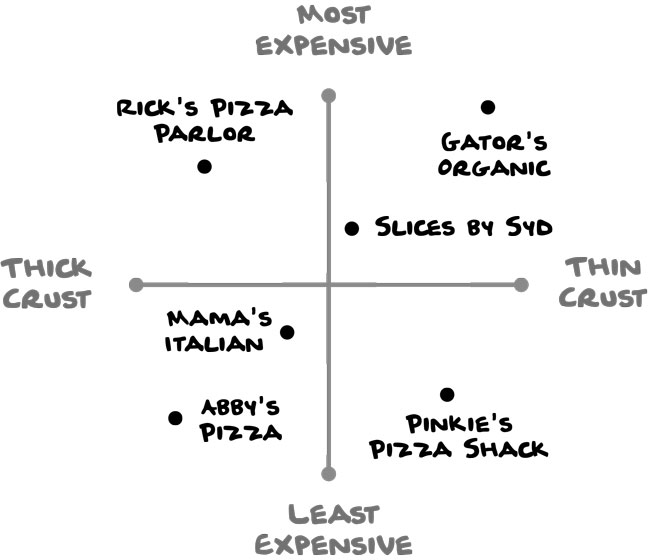
A quadrant diagram illustrates how things compare to one another. You can create one based on exact data (e.g., price of a slice, thickness of pizza-crust) or ambiguous data (e.g., fancy or casual, quality of service, or tastiness).
A quadrant diagram illustrates how things compare to one another. You can create one based on exact data (e.g., price of a slice, thickness of pizza-crust) or ambiguous data (e.g., fancy or casual, quality of service, or tastiness).